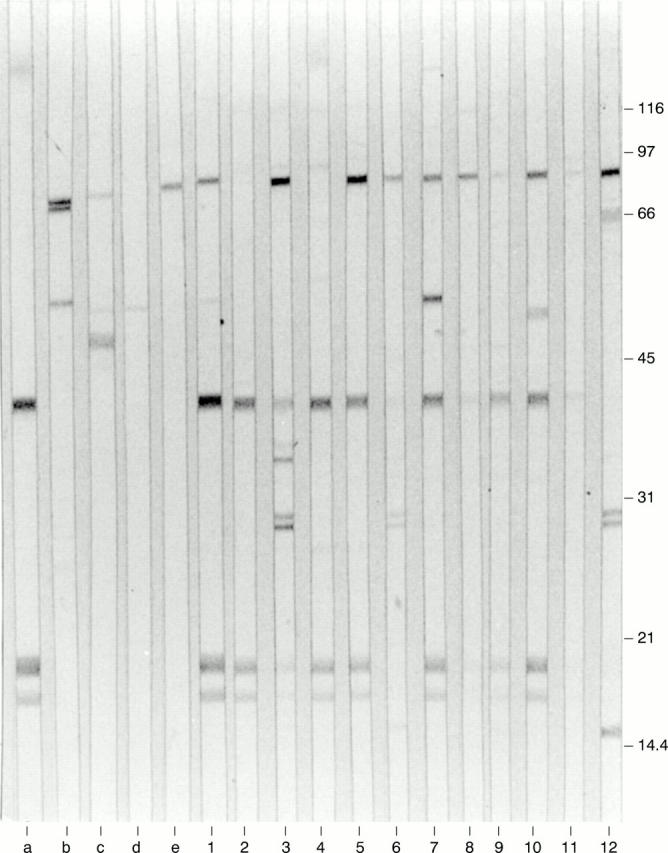
Figure 2 .

Analysis of anti-P positive SLE sera (lanes 1-12) on a cytoplasmic blot. Immunoblot was interpreted as positive with concomitant lines corresponding to 38 kDa, 19 kDa, and 17 kDa bands. Control sera: (a) anti-P prototype serum; (b) anti-mitochondrial protein serum; (c) anti-La/SSB + anti-Ro/SSA 52 kDa serum; (d) anti-Jo-1 serum; (e) control serum from a healthy donor showing the background band typically present in Raji cell extracts. Molecular weight markers are indicated in kilodaltons on the right.
