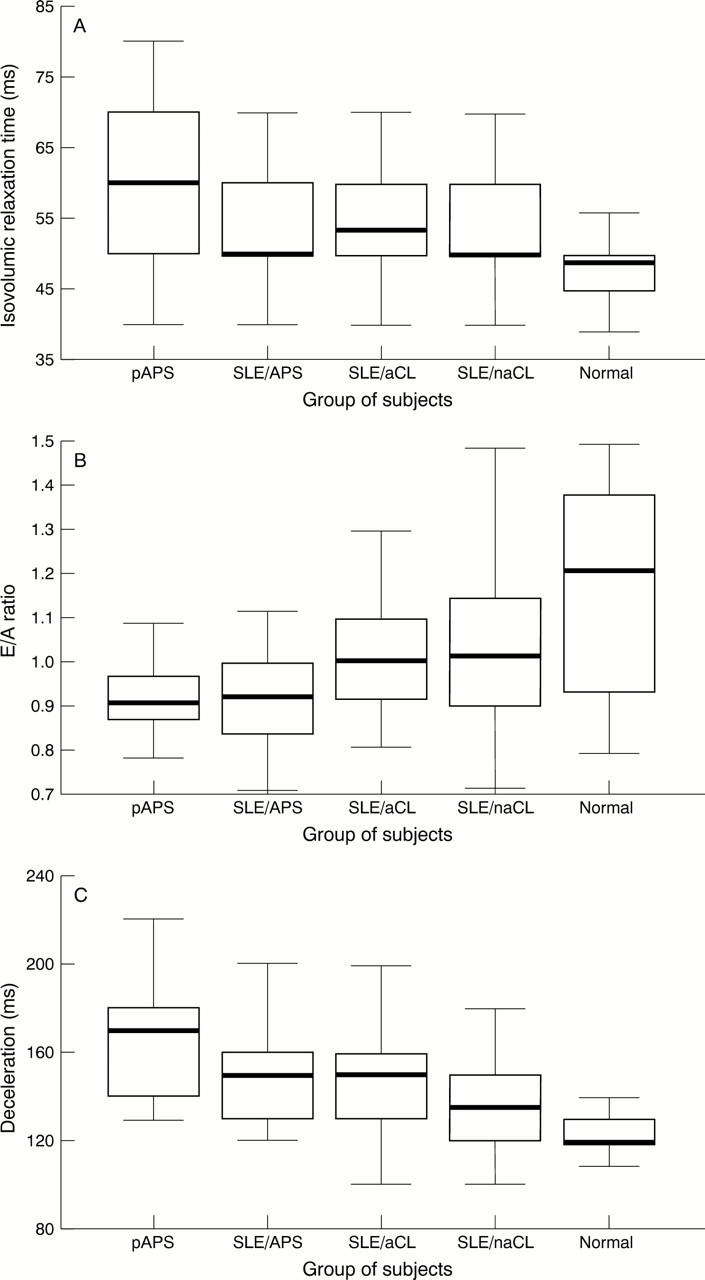
Figure 1 .

Box plots for right ventricular parameters, including (A) isovolumic relaxation time, (B) E/A ratio, and (C) deceleration time in the five groups of subjects compared. Box plots show the median (horizontal line) and the interquartile range box, together with whisker lines extending to the highest and lowest value (not showing few outliers of more than 1.5 box lengths from the box). SLE = systemic lupus erythematosus; APS = antiphospholipid syndrome; pAPS = primary APS; SLE/APS = APS secondary to SLE; SLE/aCL = SLE with aCL (without APS); SLE/naCL = SLE without aCL or APS.
