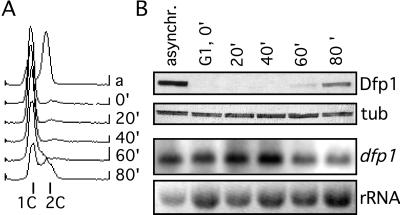
Figure 5.
Expression of Dfp1 at the G1/S transition. Cells blocked in G1 (GBY401) were released into the cell cycle and sampled every 20 min. (A) DNA content was measured by flow cytometry. The positions of 1C and 2C DNA contents are indicated. (B) Dfp1 levels were analyzed by immunoblot analysis, probing with the anti-HA antibody 16B12 (Dfp1). The blot was reprobed with anti-tubulin antibodies as a loading control (tub). RNA levels were analyzed by Northern hybridization analysis, probing with the dfp1 ORF (dfp1). The ethidium bromide-stained rRNA is shown as a control for loading (rRNA).

