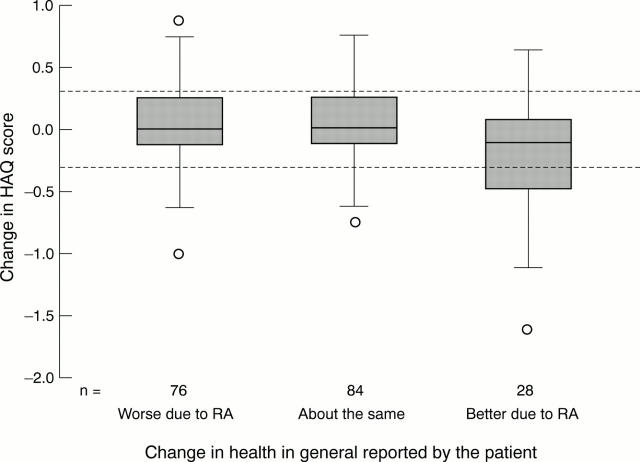
Figure 3 .
Box plots of annual Health Assessment Questionnaire (HAQ) score changes for patients with rheumatoid arthritis (RA) attending for routine outcome assessment (excluding 19 who reported change not related to their arthritis). The box plots show the median, the upper and lower quartiles (upper and lower edges of the box), the range excluding outliers (whiskers), and outliers (small circles). The dashed lines indicate the calculated limits within which 80% of differences would be expected to lie based on the score changes over two months for no patient perceived change in health in general.

