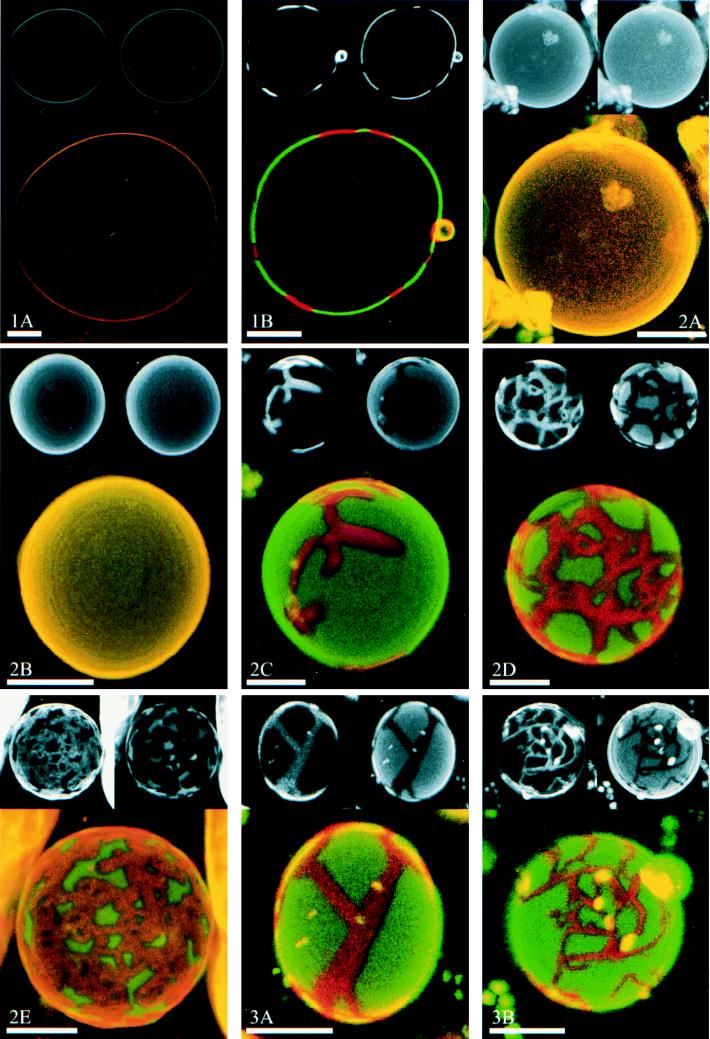
Figure 1.
The principle of lipid phase identification, showing confocal images at the equator of GUVs at a phospholipid/cholesterol composition yielding (1A) a single fluid phase (DLPC/DPPC = 1/0), and (1B) ordered-fluid two-phase coexistence (DLPC/DPPC = 0.60/0.40). In each figure, DiI-C20 fluorescence is shown in the upper left small image and Bodipy-PC fluorescence in the upper right. Thus, the merged large lower image shows spatially ordered phase regions in red (DiI-C20 fluorescence) and fluid phase in green (Bodipy-PC fluorescence). The asphericity of these GUVs indicates lack of osmotic stress. A small adherent vesicle is visible in 1B and in several subsequent images. (Bars = 10 μm.) (2A–2E) Visualization of phase separation in the binary lipid mixture of DLPC/DPPC. The images show a progression of increasing DPPC concentration relative to DLPC at DLPC/DPPC values: 1/0 (2A), 0.80/0.20 (2B), 0.60/0.40 (2C), 0.40/0.60 (2D), and 0.20/0.80 (2E). Note that the vesicle shown in 2D is not unilamellar, but instead consists of two bilayers which are very close to each other. Image 2D shows two concentric GUVs, chosen to demonstrate the principle of superposition of phase domains in apposing monolayers (see text). No GUVs were formed in pure DPPC; apparently some fluid phase must be present for successful preparations of GUVs by this method. The circular rings of contrast in these and subsequent images are due to nonuniform axial stepping between confocal images and do not indicate compositional inhomogeneities. (Bars = 10 μm.) (3A and 3B) Influence of cholesterol on the two-phase region. GUVs at a constant ratio of DLPC/DPPC = 0.50/0.50 were prepared with increasing cholesterol concentrations of 0 (3A) and 5 mol % (3B). For cholesterol ≥10 mol %, images were identical in appearance to 2A and 2B. For explanation, see text. (Bars = 10 μm.)

