Figure 2.
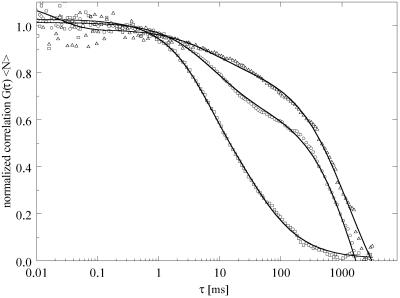
Diffusion properties in laterally ordered and fluid phases in the absence of cholesterol, corresponding to Fig. 2. FCS autocorrelation curves were obtained for samples of composition DLPC/DPPC (□ = 1/0, ○ = 0.60/0.40, and ▵ = 0.20/0.80). Solid curves are data-fitting curves for diffusion theory from which DT values were determined. In this and all subsequent figures, correlation amplitudes are normalized to 1 by multiplying G(τ) with the average number of fluorescent molecules in the focal area 〈N〉 to compare the shapes of the curves for different compositions.

