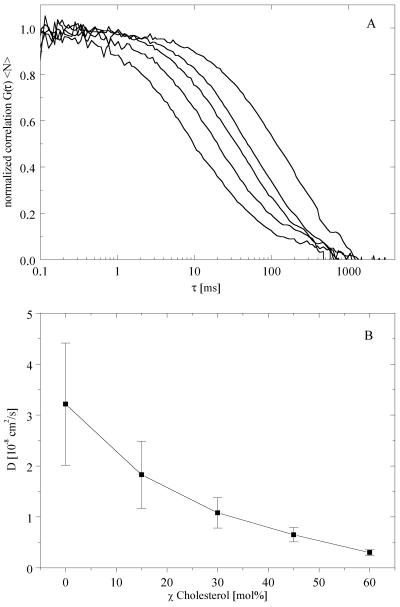
Figure 3.
The binary lipid mixture DLPC/cholesterol exhibits a continuous change in diffusion coefficient. (A) Autocorrelation curves at increasing cholesterol concentration are shown (from left to right) for the compositions of DLPC with 0, 15, 30, 45, and 60 mol % cholesterol. Each autocorrelation curve represents the average of five separate vesicles measured. (B) Average diffusion coefficients determined from the autocorrelation curves in A. The error bars correspond to the entire range of diffusion coefficients obtained from the individual FCS measurements.

