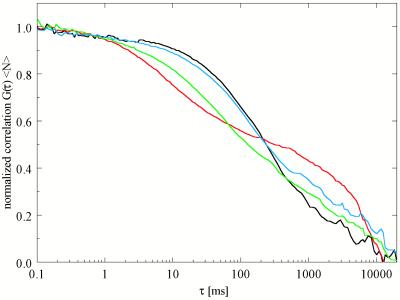
Figure 4.
FCS autocorrelation curves corresponding to the cholesterol compositions shown in Fig. 3, at constant DLPC/DPPC = 0.50/0.50. Cholesterol concentrations: red indicates 0, green indicates 5, blue indicates 10, and black indicates 15 mol %. For explanation, see text.

