
Figure 1 .
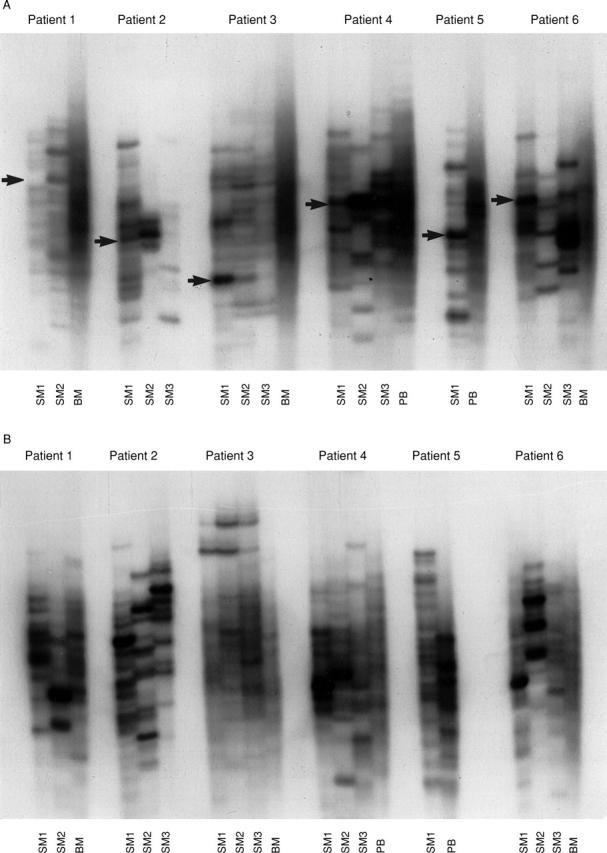
(A) Results of a µ RT-PCR-SSCP analysis of B cells from the synovial membranes (SM), bone marrow (BM), and peripheral blood (PB) from patients with osteoarthritis 1-6. The positions of the bands sequence-analysed are shown by arrows. (B) The results of a γ RT-PCR-SSCP analysis.