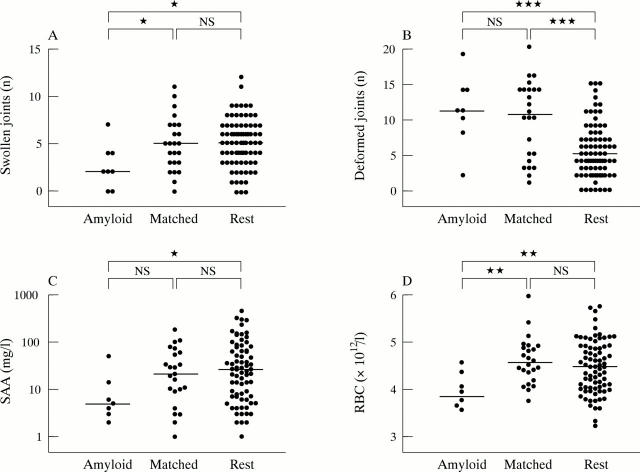
Figure 2 .
The amyloid patients, matched non-amyloid patients, and the remaining non-amyloid patients. Horizontal lines indicate median values and the asterisks indicate the differences (*p<0.05; **p<0.01; ***p<0.005; NS, not significant) between the median values of the groups. (A) Number of swollen joints (maximum 38); (B) number of deformed joints (maximum 38); (C) serum amyloid A protein (SAA) concentration (mg/l); (D) number of red blood cells (RBC) x1012/l.

