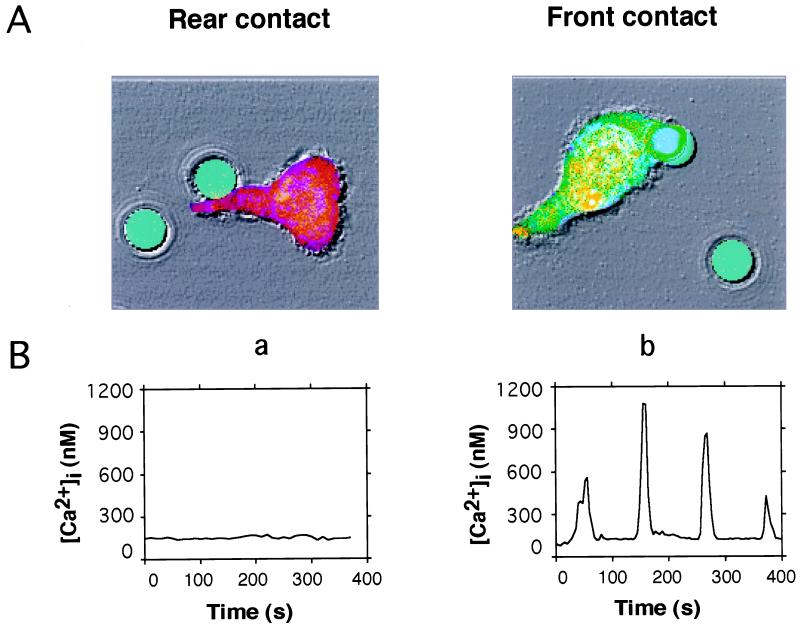
Figure 1.
Optical trapping of anti-CD3 mAb coated-bead identifies functional T cell polarity. (A) Bright field and fluorescence images are shown as an overlay. Acetoxymethyl esters of Oregon Green and Fura Red were preincubated with T cells for 90 min. Cells produced a true-color emission shift from red to green when [Ca2+]i was elevated. Three photomultipliers collected green fluorescence, red fluorescence, and bright field images simultaneously. FITC-conjugated anti-CD3 mAb coated-beads (6.2 μm in diameter) are shown presented by the optical trap to either the tail (a) or leading edge (b) of the T cell. (B) Time course of [Ca2+]i for cells shown in A. [Ca2+]i was estimated every 4 s by dividing 488-nm-excited green and red fluorescence images pixel by pixel and applying the equation of Grynkiewicz et al. (11).

