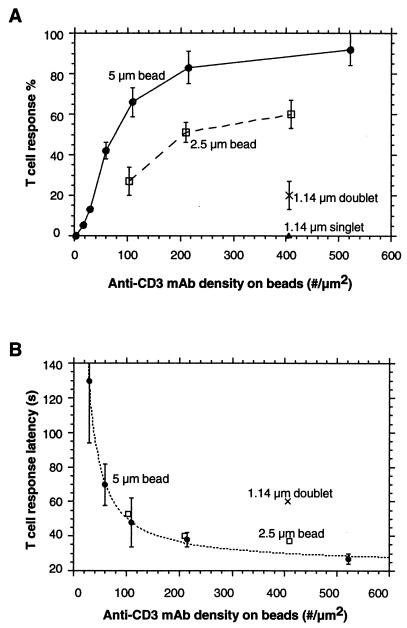
Figure 3.
T cell response depends on anti-CD3 mAb density on beads and contact area between the T cell and the bead (n = 30 cells per point). (A) T cell response percentage to beads of varying size and antibody density. Contact areas were 9.5 μm2, 4.9 μm2, 3.0 μm2, and 2.0 μm2 for 5-μm, 2.5-μm, and 1.14-μm doublet beads and 1.14-μm singlet beads, respectively. (B) T cell response latencies corresponding to initiation of [Ca2+]i signals in A. Measured response latencies (T) for 5-μm-diameter beads were fit to a pseudo-first-order rate expression with constant offset (T2): T = K*ln[D/(D − A)] + T2 (dashed line). T, latency time; D, anti-CD3 mAb density on beads; K, constant; A, anti-CD3 mAb threshold density; T2, the minimal time for downstream signal transduction events leading to the [Ca2+]i rise. The parameters obtained from the fit were A = 13 per μm2 and T2 = 23 s. Standard error bars are shown in the figure.

