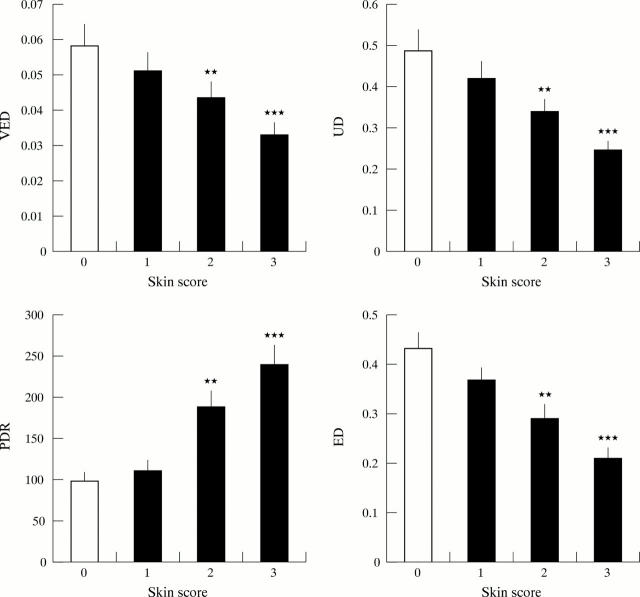
Figure 2 .
Relation between sclerosis score and biomechanical properties of skin. For each of the three skin areas assessed (forearm, shoulder, and back) the VED, UD, PDR and ED were compared for areas scored between 0 and 3. Representative histograms summarise data from forearm skin sites scored 0 (n=14), 0 (n=24), 2 (n=15), or 3 (n=8). Indices of skin deformity were lower at higher skin scores, whereas the PDR, reflecting stiffness, was increased. Data show means (SEM) and comparison is by Student's unpaired t test. **p<0.01, ***p<0.001.

