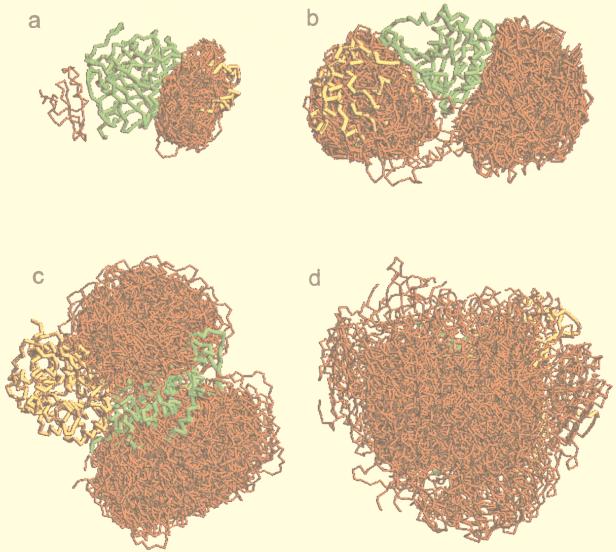
Figure 1.
Examples of the distribution of ligand positions. Receptors are shown in green and ligands in yellow, in the crystallographically determined position within the complex. The 100 lowest-energy ligand positions are shown in red. Matches are clustered primarily inside the binding area (a), inside and outside the binding area (b), outside the binding area (c), and not clustered (d).

