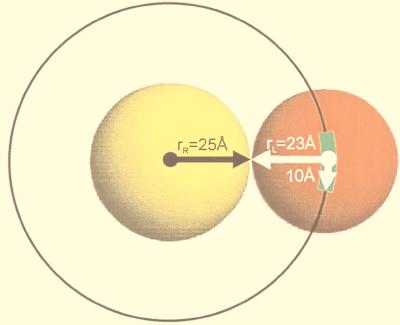
Figure 2.
Idealized representation of proteins. The receptor is shown in yellow and the ligand in red. Radii are calculated as the average distance of all atoms in a protein from its center of mass. The radii shown are the average radii of all receptors and ligands. The binding region is defined as the area within 10 Å of the crystallographic position of the ligand’s center of mass and is shown in green.

