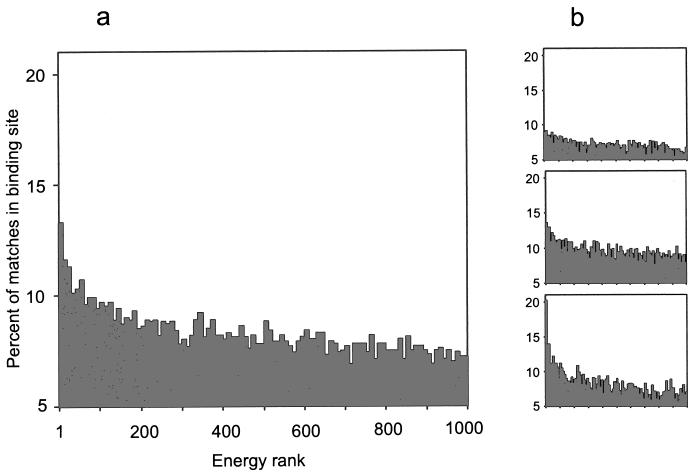
Figure 3.
Percent of matches inside the binding area according to the energy rank. The percent is based on the inside/total ratio of the matches of a given rank (see text). Energy rank is accumulated in the histogram in groups of 10. (a) All complexes. (b) Complexes with interface of 1,000–2,000 Å2 (Top), 2,000–4,000 Å2 (Middle), and >4,000 Å2 (Bottom).

