
Figure 2 .
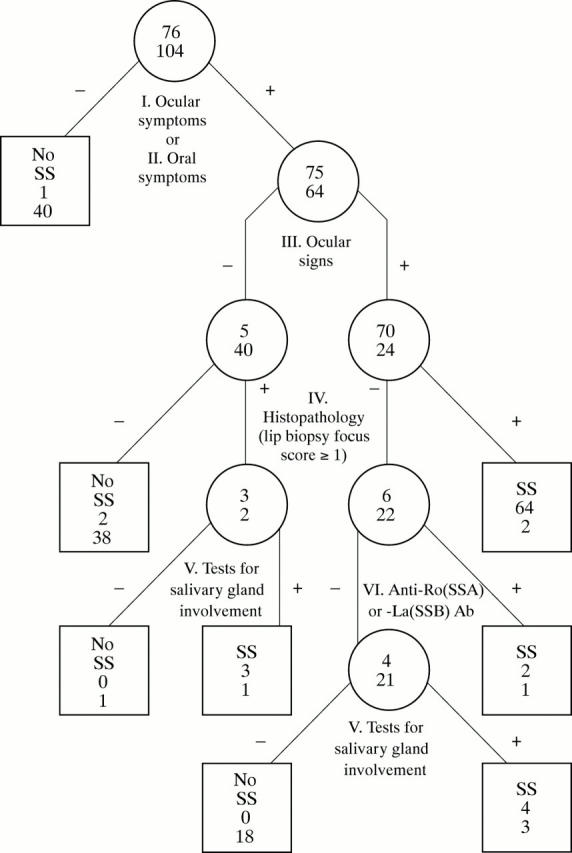
Classification tree performance of the classification criteria for SS. Schematic representation of the classification tree for the classification of primary SS. Within each circle the number of patients with primary SS (upper value) and the number of controls without SS (lower value) are reported. The boxes show the numbers of subjects who could be classified either as having SS or not having SS (No SS). The variable used in each node of the tree to discriminate between patients and controls is reported beneath the circles. Following the entire sequence allowed us to classify correctly 73/76 patients with primary SS (sensitivity 96.1%) and 98/104 disease controls (specificity 94.2%).