
Figure 3.
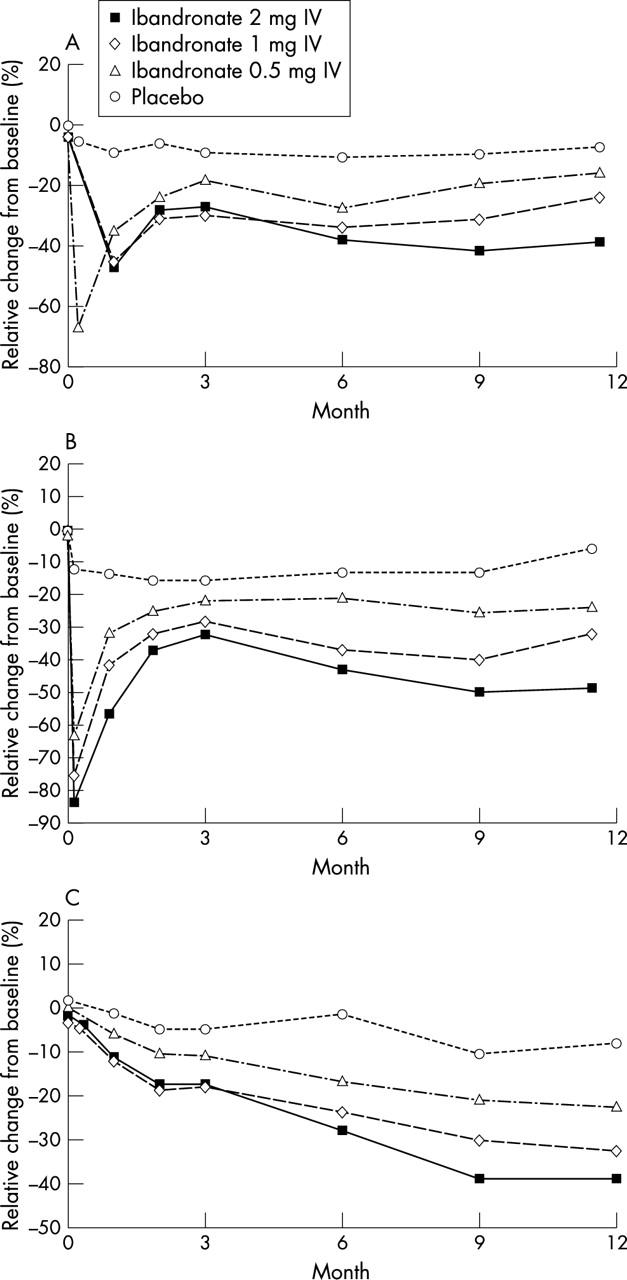
Relative percentage change from baseline in (A) serum CTX, (B) urinary CTX/creatinine, and (C) serum osteocalcin levels in the ITT population.
Official websites use .gov
A
.gov website belongs to an official
government organization in the United States.
Secure .gov websites use HTTPS
A lock (
) or https:// means you've safely
connected to the .gov website. Share sensitive
information only on official, secure websites.
Relative percentage change from baseline in (A) serum CTX, (B) urinary CTX/creatinine, and (C) serum osteocalcin levels in the ITT population.