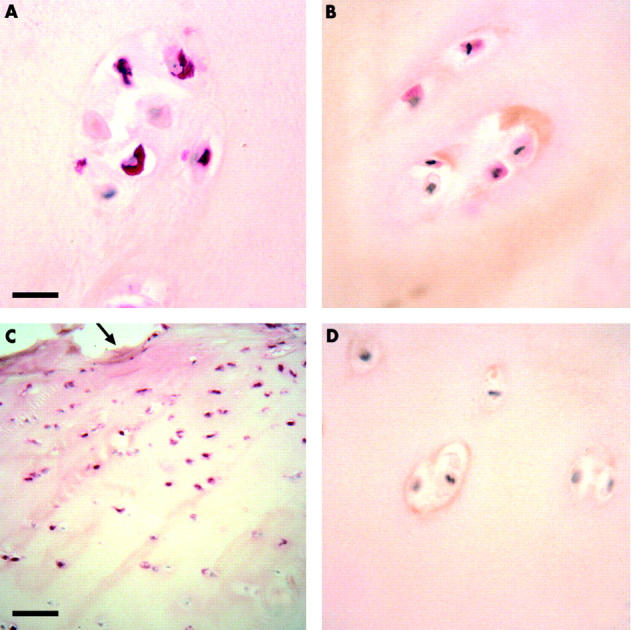
Figure 3.

Immunolocalisation of histamine and histidine decarboxylase in chondrocytes of OA cartilage. (A) Tissue section of OA cartilage showing a proportion of the cells in a chondrocyte cluster positive for histamine (red). (B) Tissue section of OA cartilage with a proportion of cells of a chondrocyte cluster immunostained for HDC (red). (C) Low power micrograph of tissue section of OA cartilage showing histamine expression by HAC predominantly in the superficial articular surface (arrowed), and not in the deeper regions of the articular cartilage. (D) Control tissue section with normal rabbit IgG as substitute for primary antibodies showing no immunostaining. Bar = 25 µm for micrographs A, B, and D; bar = 140 µm for micrograph C. All sections were lightly counterstained with Harris's haematoxylin.
