
Figure 4.
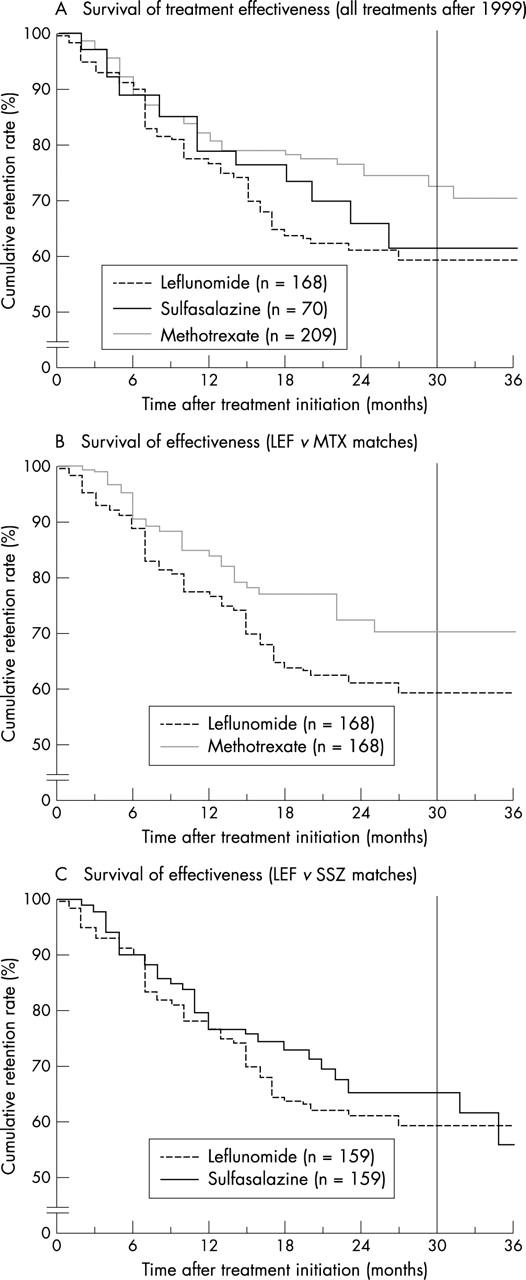
Survival of treatment effectiveness. Cumulative drug retentions (%) of LEF, MTX, and SSZ, when only discontinuation due to inefficiency was analysed, assuming permanent safety otherwise (that is, censoring at time of occurrence). The period to the right of the reference line (30 months) indicates an unduly small number of patients left at risk (<10%). Note the discontinuous y axis. (A) All treatments after 1999, mean survivals (SE) of the drugs (months)—MTX (n=209): 33 (1); SSZ (n=70): 30 (2); and LEF (n=168): 26 (1). Breslow test: p=0.04 for MTX v LEF, otherwise: p=NS. (B) Matched analysis of LEF v MTX (n=168)—LEF: 26 (1) v MTX: 32 (1); Breslow test: p=0.04. (C) Matched analysis of LEF v SSZ (n=159)—LEF: 26 (1) v SSZ: 30 (1); Breslow test: p=NS.