Figure 3.
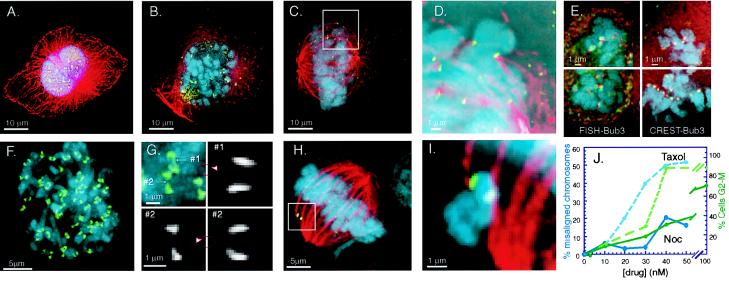
Immunolocalization of hBub3 in HeLa cells. Representative optical sections from each deconvolved data set are presented with Bub3 in green, tubulin in red, and DNA in blue. (A) An early prometaphase cell chosen from an asynchronous culture. (B) Late prometaphase cell. (C) Metaphase cell. (D) An enlarged view of the highlighted square in C. (E) Images of cells costained by using mBub3 antisera and either alpha-satellite fluorescent in situ hybridization (FISH) (Left, FISH red, Bub3 green) or CREST antikinetochore sera (Right, CREST red, Bub3 green). (F) Cell after treatment for 18 hr with a high concentration (1 μM) of nocodazole (tubulin is depolymerized by this treatment). (G) Bub3 forms a distinct structure on kinetochores. Two enlarged images of kinetochores from the nocodazole-treated cell in F, marked 1 and 2, were magnified and then rotated about their long axes to show their characteristic crescent-like structure. (H) Cell after treatment for 20 hr with a low concentration (20 nM) of taxol. Two bright Bub3 signals are visible on a lagging chromosome that projects out of the page. (I) Magnified view of lagging chromosomes from the metaphase cell in H. (J) Percentage of cells with Bub3-positive lagging chromosomes after 20-hr treatment with 0–50 nM taxol (dashed blue line) or nocodazole (solid blue line). Percent of cells treated that were arrested in G2/M as judged by FACS analysis (taxol, dashed green line; nocodazole, solid green line).

