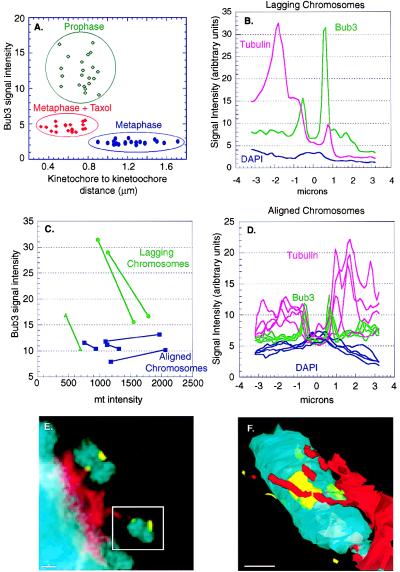
Figure 4.
Relationship between Bub3 signal strength and microtubule attachment. (A) Plot of Bub3 signal intensity versus kinetochore-to-kinetochore distance for an untreated prophase cell (green points), a metaphase cell (blue points), and a cell with metaphase morphology treated for 30 min with 10 μm taxol (red points). Peak signal intensities in the Bub3 channel are reported without background correction. (B) Relationship of Bub3, tubulin and DNA (DAPI, 4′,6-diamidino-2-phenylindole) fluorescent intensities along a line normal to the kinetochores of a lagging chromosome. (C) Plot of peak Bub3 staining intensities versus microtubule intensities for three lagging and four aligned chromosomes by using data derived from the graphs in B and D. (D) Relationship of Bub3, tubulin, and DNA intensities for four aligned chromosomes. (E) HeLa cell treated with 20 nM taxol for 16 hr showing two lagging chromosomes bound to what appear to be astral microtubules. Chromosomes stain blue, microtubules red, and Bub3 yellow (a pseudo-color substitute for FITC). (F) Model of a lagging chromosome from E, showing what appears to be a lateral attachment to a microtubule. Transparent modeling of the chromosome allows the smaller, spindle pole-proximal Bub3 signal to be seen through the DNA.

