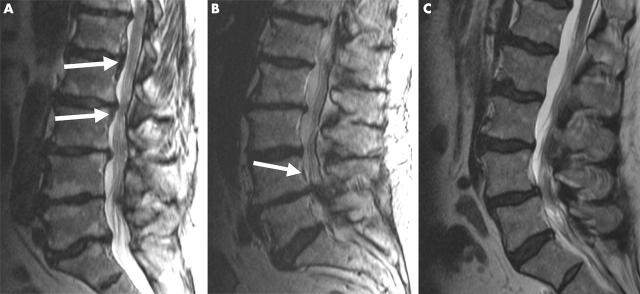
Figure 1 .
T2 weighted transaxial MRI scans (TR 6000 ms/TE 105 ms) of probands 2 (A), 10 (B), and 23 (C). (A) A hypertrophic band is seen at the L2–3 disc level and caudally at L3–4 (white arrows). Both disc and end plate degeneration are seen at all lumbar levels. (B) The scan shows OPLL at the L4 vertebral level (white arrow). This proband also had severe disc and end plate degeneration at multiple lumbar levels. (C) The scan indicates severe disc degeneration at multiple lumbar levels, and a Schmorl's node at L2–3.

