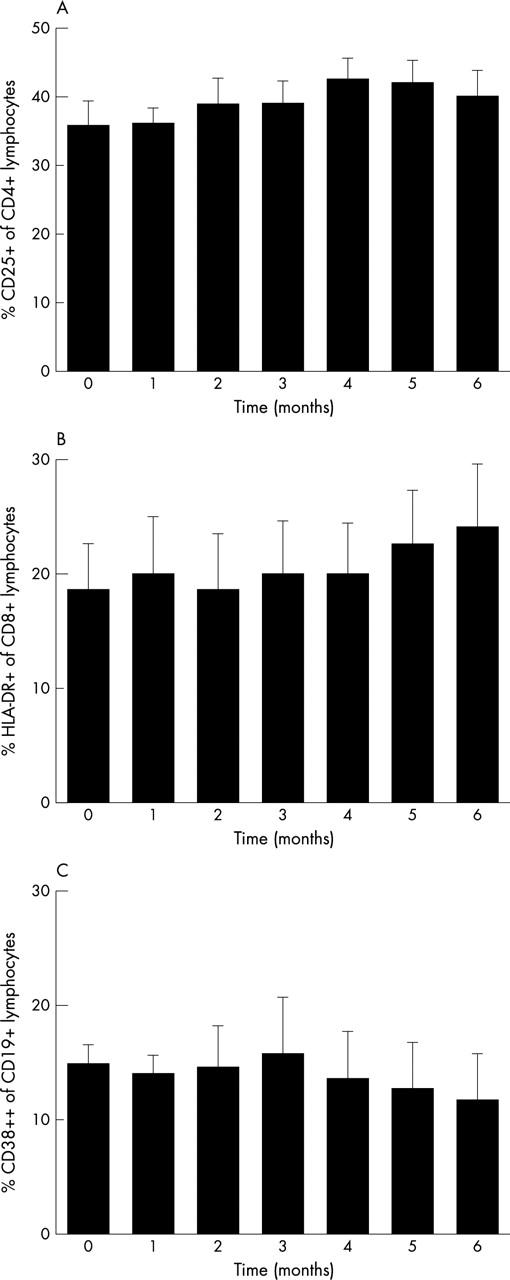
Figure 3.

Activation state of lymphocytes during six months of treatment with MMF. (A) Activation state of CD4+ lymphocytes depicted as the percentage of these cells staining positive for the activation marker CD25. (B) Activation state of CD8+ lymphocytes depicted as the percentage staining positive for HLA-DR. (C) Activation state of CD19+ lymphocytes expressed as the percentage of CD38++ lymphocytes. Data are presented as mean (SE).
