
Figure 4.
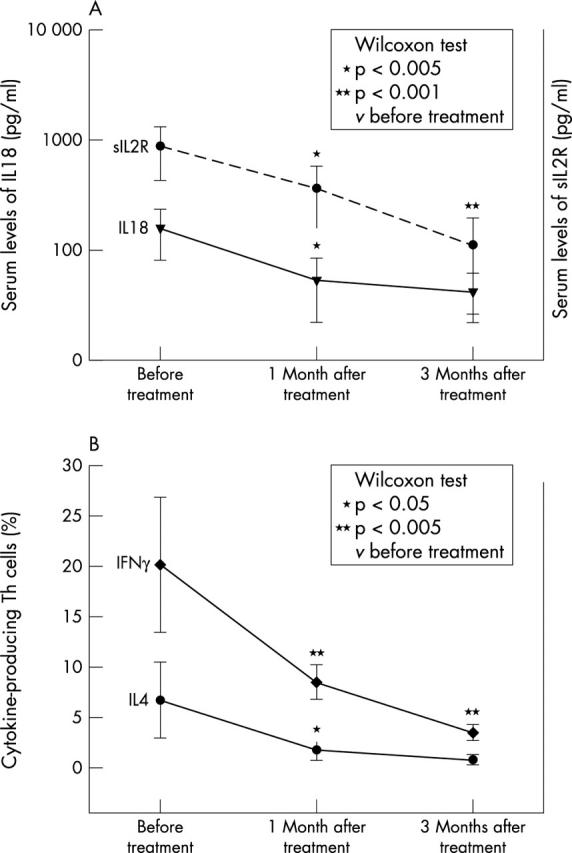
Serial changes in (A) the levels of IL18 and sIL2R in serum, and in (B) the mean percentage of IFNγ-and IL4-producing Th cells in PB of 12 patients with AOSD before treatment and at 1 and 3 months after treatment with GC, NSAIDs, and methotrexate. Data are presented as mean (SEM).