
Figure 1.
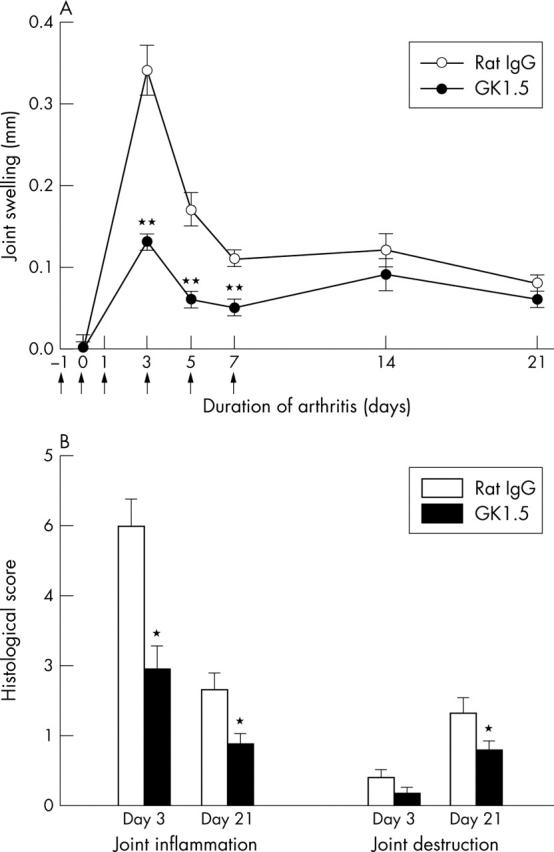
Joint swelling and histology of AIA. (A) Time course of joint swelling in AIA after treatment with the anti-CD4 mAb GK1.5 or control rat IgG. Results are expressed as means (SEM) of 10 individual animals in each group. Arrows indicate the days of treatment (days –1, 0, 1, 3, 5, and 7). (B) Histological score of joint inflammation and joint destruction in the acute phase (day 3) and the chronic phase (day 21) of AIA. Results are expressed as means (SEM) of 10 individual animals in each group. *p⩽0.05, **p⩽0.01 in comparison with IgG treated controls.