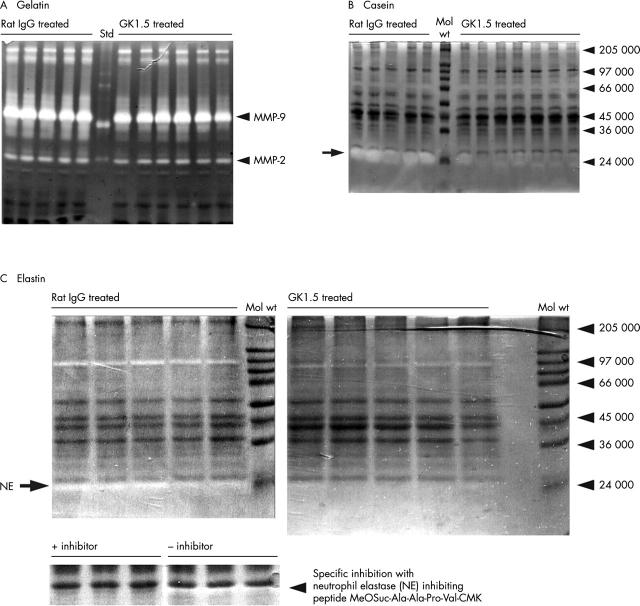
Figure 6.
Zymography of joint extracts on day 3 of AIA. Zymography of equal amounts (protein content) of joint extracts from GK1.5 treated or rat IgG treated mice using (A) gelatin, (B) casein, or (C) elastin as a substrate. Markers of molecular weight (Mol wt) or the positions of recombinant human MMP standards (Std) are indicated on the right. Elastase activity in (C) was blocked by the specific inhibitor MeOSuc-Ala-Ala-Pro-Val-CMK.

