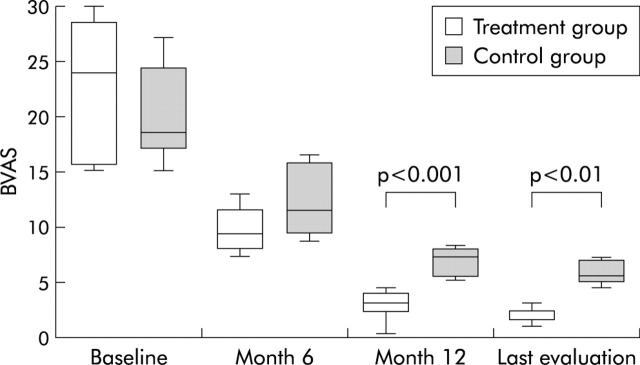
Figure 2.
Box plots show the median values (solid line) plus 95% confidence intervals of Birmingham Vasculitis Activity Score (BVAS) for treatment (white bars) and control (shaded bars) groups. At month 12 and at last assessment, patients receiving combined treatment had a statistically significant difference in the vasculitis activity scores than those treated with a "standard" prednisone/cyclophosphamide treatment (Mann-Whitney U test). Error bars represent the range.

