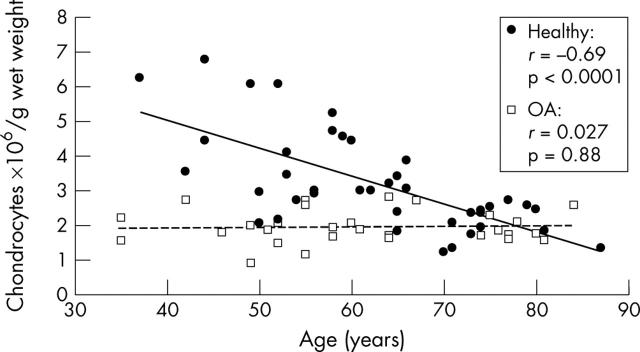
Figure 1.
Changes in the total chondrocyte numbers of healthy and osteoarthritic articular cartilage with increasing age. Chondrocytes were enzymatically released from their extracellular matrix in 0.2% collagenase B. Directly after digestion cell numbers were assessed using light microscopy. The values are given as chondrocytes x106/g wet weight. There was a decrease in chondrocyte numbers in healthy articular cartilage (black circles, black regression line) as a function of age (n = 41; r = –0.69, p<0.0001). Cellularity in osteoarthritic cartilage (white squares, dashed regression line) showed a significant reduction in cell number compared with healthy cartilage (p<0.0001), but no dependence on patients' age (n = 30; r = 0.027, p = 0.88).

