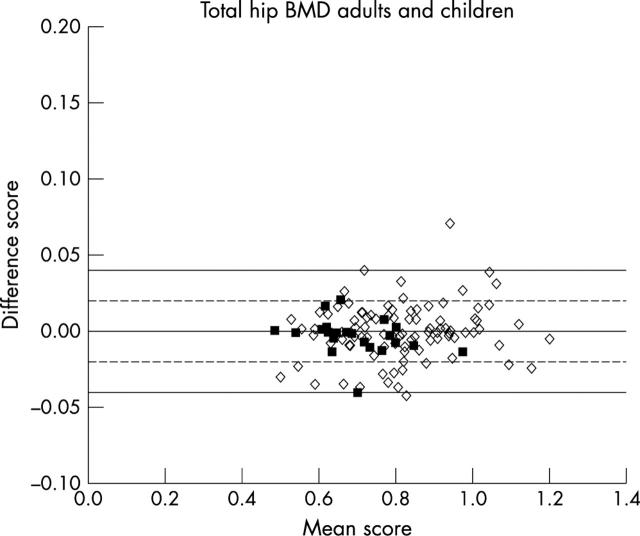
Figure 1 .
Graph of the difference score against the mean score of the two total hip BMD measurements (g/cm2) in postmenopausal women (open diamonds) and children (closed squares). The outermost (solid) lines represent the 95% limits of agreement for postmenopausal women. The inner (dashed) lines represent the 95% limits of agreement for children.

