
Figure 1 .
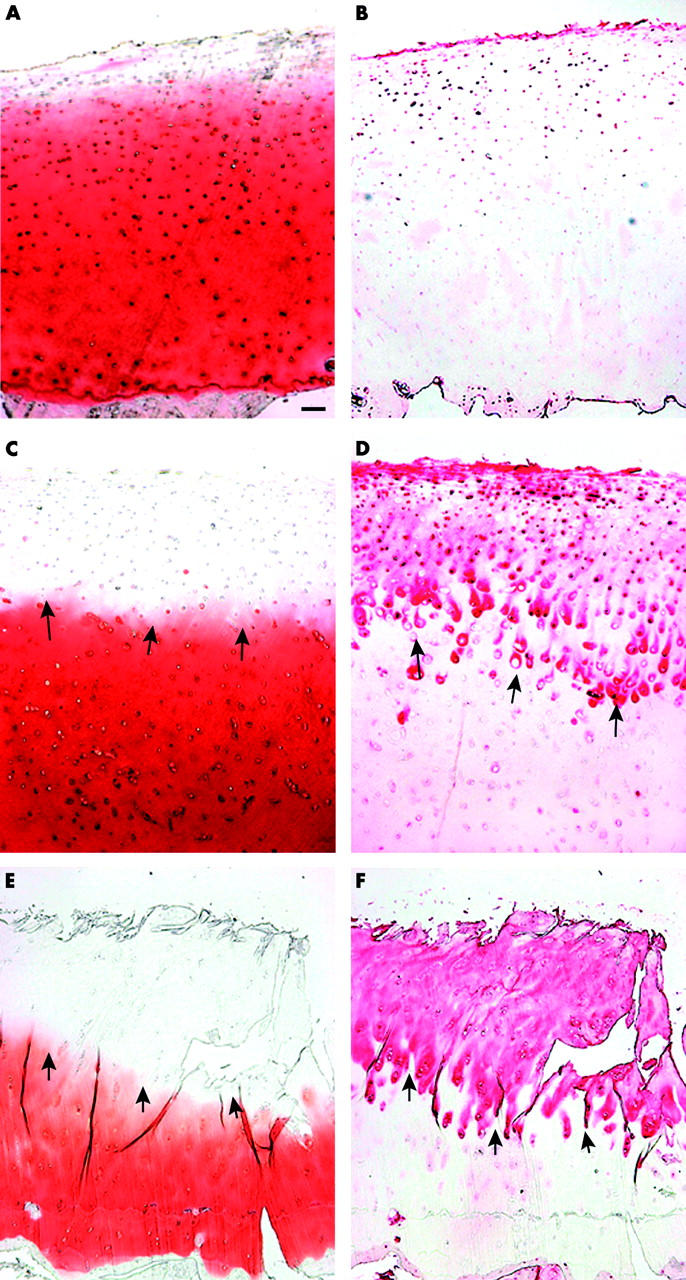
Serial sections of normal and OA cartilage. The tenascin deposition in healthy cartilage varied interindividually. Normal cartilage stained for proteoglycans (A) and immunostained for tenascin (B) shows pericellular/territorial tenascin deposition around the superficial and upper middle zone chondrocytes (weak immunostaining). (C) Mild OA lesion with decreased proteoglycan staining of the upper cartilage (safranin O staining). (D) Immunohistochemical analysis of tenascin in the same section as shown in C (note the territorial staining around the middle zone chondrocytes indicated by arrows). (E) Severe OA cartilage lesion showing a strong reduction of proteoglycans, deep clefts within the deep zone, and chondrocyte clusters in all zones (safranin O staining). (F) Immunostaining of tenascin in the same section as shown in E (note the strong tenascin staining in cartilage areas showing the absence of proteoglycans indicated by arrows). The bar in A represents 100 µm in A-F.