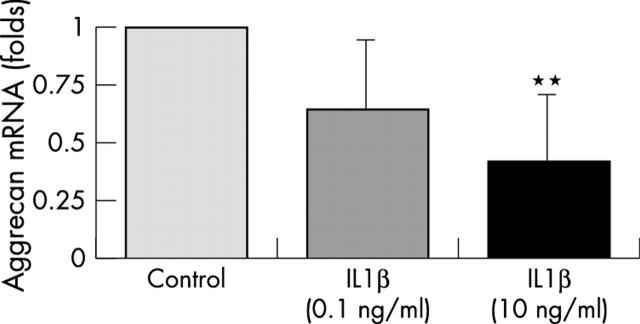
Figure 3 .
Bars represent the several-fold changes of aggrecan mRNA levels (normalised to 18S rRNA) of IL1ß treated chondrocytes compared with untreated control chondrocytes (one fold expression). Articular chondrocytes were cultured under serum free conditions for 18 hours in the absence or presence of 0.1 and 10 ng/ml IL1ß, respectively. Results are from four independent cell culture experiments. Bars represent means (SD). **p<0.01 versus control.

