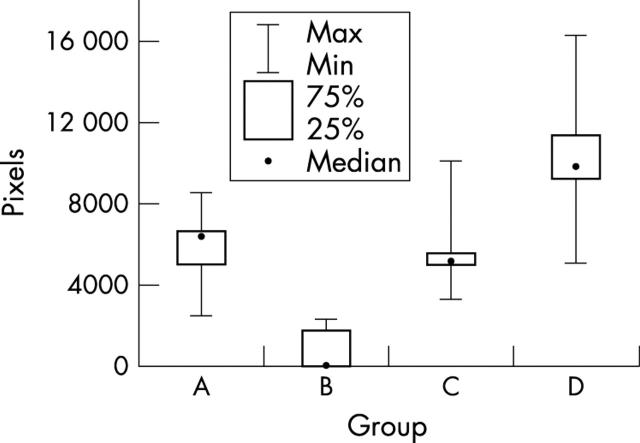
Figure 2 .
Box plots showing the median, minimum, maximum, and quartile pixel values for each group of patients. The relative interferon regulatory factor-1 (IRF-1) mRNA expression to 18s rRNA levels is presented as box plots with median and interquartile ranges for each group. Group A, seven myelodysplastic patients with autoimmune manifestations; group B, seven myelodysplastic patients without autoimmune manifestations; group C, five patients with systemic vasculitis; group D, seven normal individuals.

