Figure 1 .

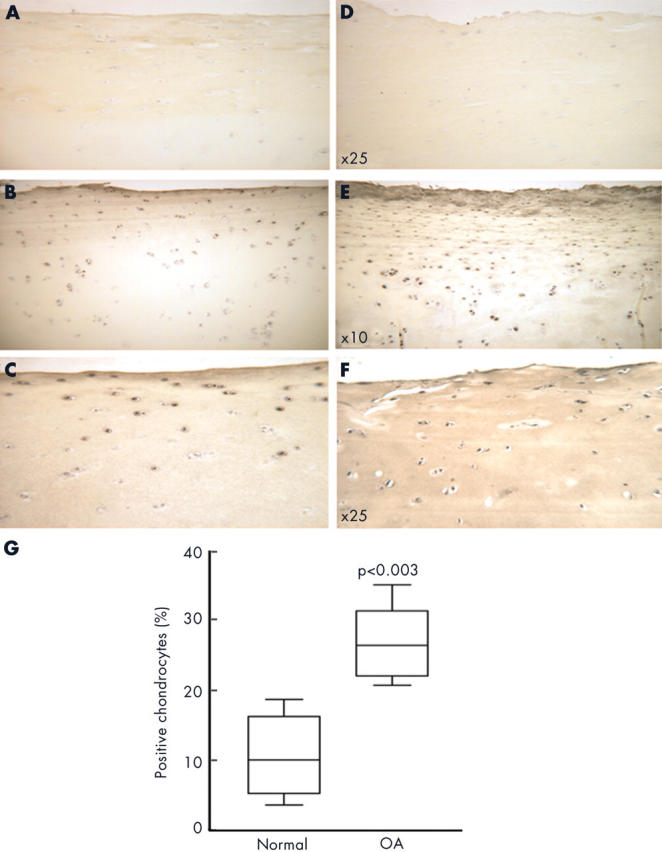
Representative section of cartilage, showing immunostaining for galectin-3 from normal (A–C) and OA cartilage (D–F). (A and D) Non-immune serum; (B, C, E, and F) polyclonal anti-galectin-3. Original magnification x25; (G) galectin-3 levels over the entire cartilage thickness. Data are presented as box plots, where the boxes represent the first and third quartiles, the lines within the boxes represent the median, and the lines outside the boxes represent the spread of the galectin-3 cell scores outside the first and third quartiles. The p value, obtained with the Mann-Whitney test, indicates the difference compared with the normal group.
