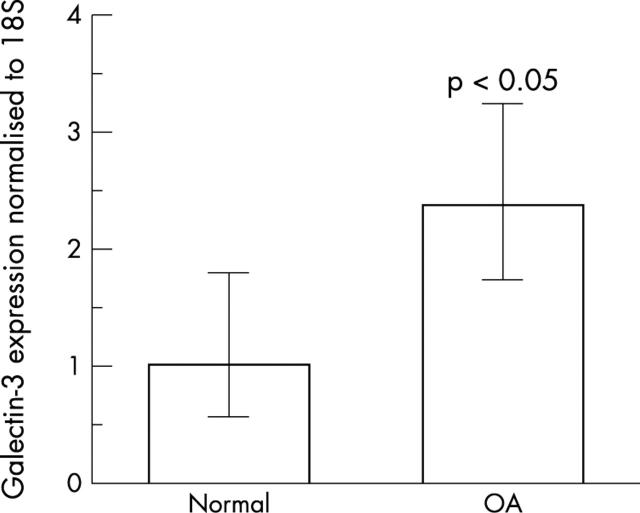
Figure 2 .
Expression of galectin-3 mRNA in human normal and OA cartilage was studied using real time RT-PCR as described in "Materials and methods". The PCR analysis was performed by normalising the PCR products of the galectin-3 to the 18S PCR products. Bars show the mean (SD) intensity of five normal and OA specimens. The p value, obtained with Student's t test, indicates the difference compared with the normal group.

