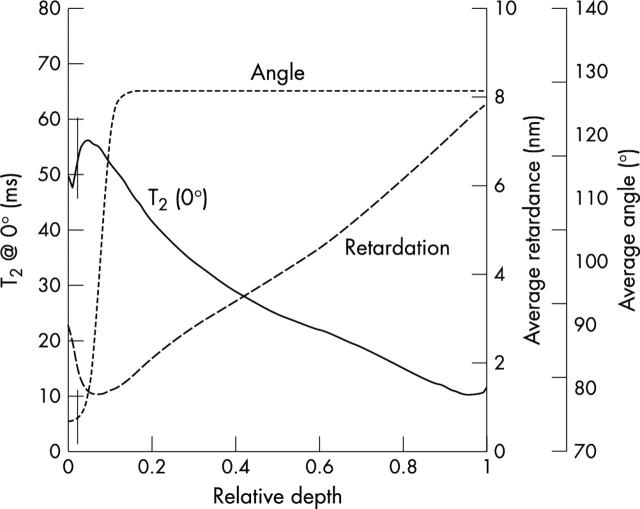
Figure 3 .
At the left y axis: T2 profile at ~0° versus the relative depth extracted from a 20 pixel column from the middle of an OA specimen with 13.7 µm in-depth resolution (solid line). At the right y axis: average optical retardation (dashed line) and average collagen orientation angle (dotted line) were plotted versus the relative depth of the same OA specimen with 13.6 µm in-depth resolution. The vertical lines correspond to the determined border between the superficial and the transitional zone.

