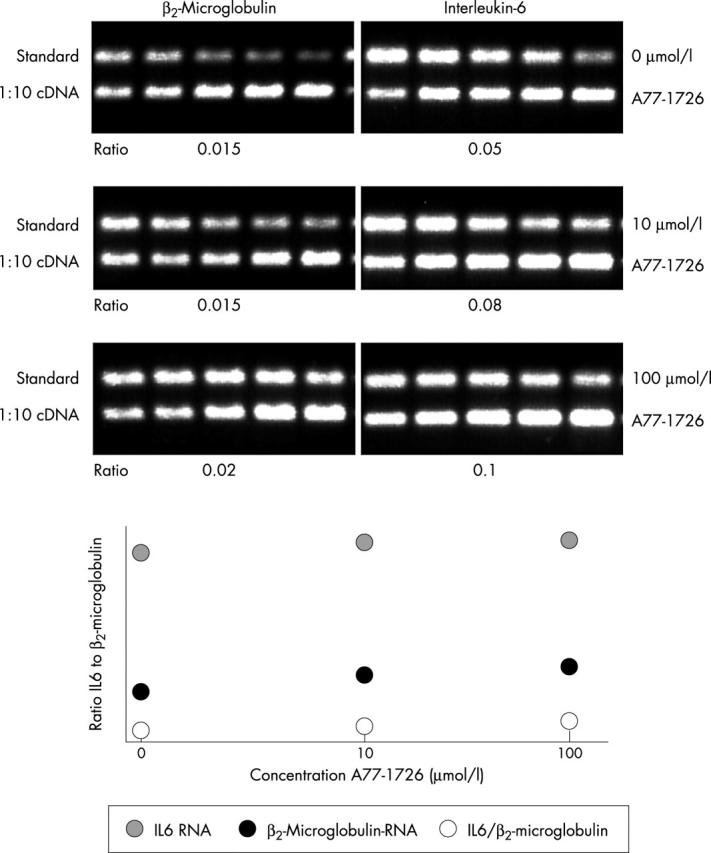
Figure 2.

Analysis of ß2-microglobulin and IL6 mRNA levels in PHA stimulated monocytes. A constant volume of the ß2-microglobulin and IL6 cellular cDNA products was mixed with graded amounts of a known concentration of pQA1 DNA (st-DNA) containing the specific sequences for the ß2-microglobulin and IL6 PCR primers. PCR was performed, and the PCR products were separated by electrophoresis on a 1% agarose gel and visualised after ethidium bromide staining under ultraviolet light. The concentration of st-DNA that gave an amount of PCR product equal to that of the cellular DNA ß2-microglobulin or IL6 PCR products, respectively, was determined. The intensity of the bands was quantified by densitometry. The density of the st-DNA was expressed as a percentage of the total density of st-DNA and cellular cDNA. Results are presented in the absence of A77-1726, and the presence of 10 µM and 100 µM A77-1726.
