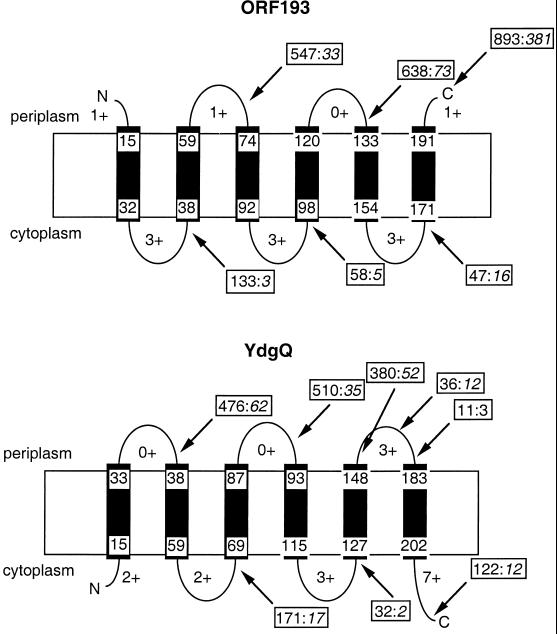
Figure 3.
Topology models for ORF193 (Upper) and YdgQ (Lower). PhoA fusions are indicated by arrows, together with their respective measured and normalized alkaline phosphatase activities (measured/normalized; the latter are expressed in arbitrary units). Approximate ends of the TM segments as well as the number of positively charged residues (Lys+Arg) in the tails and loops are indicated.

