
Figure 3.
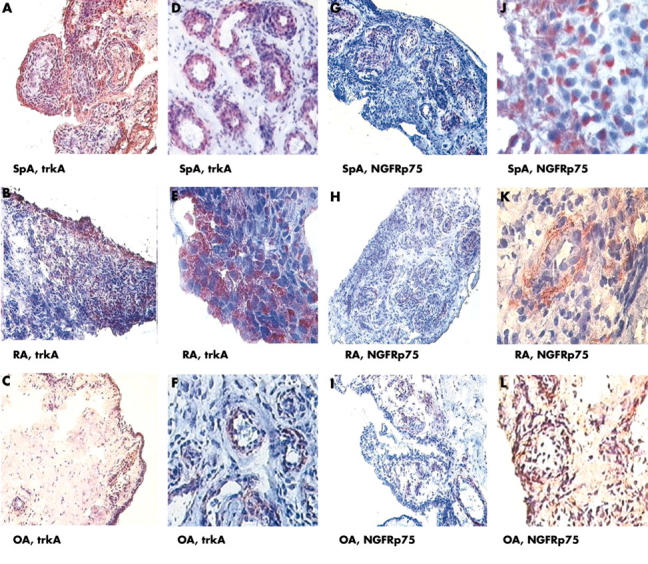
Microscopic pictures of ST sections from 12 different patients are depicted. (A–F) immunostaining of synovial tissue samples of two different patients with SpA, RA, and OA each at low (A, B, C, x160) and high magnification (D, E, F, x320). In patients with SpA, intensive trkA staining predominantly in the lining layer (A) and less intense staining in the sublining layer and the endothelium (D) is seen. In patients with RA, a similar pattern for trkA staining is seen (B, x160 and E, x320) and correspondingly for patients with OA (C, F). (G-L) NGFRp75 immunoreactivity showing an intense staining in the sublining layer (G, J) of patients with SpA. However, immunoreactivity for NGFRp75 is less intense in RA (H, K) and OA (I, L) than in SpA. In all three groups, NGFRp75 staining is not seen in the lining layer, but it is found in the endothelium of patients with SpA.