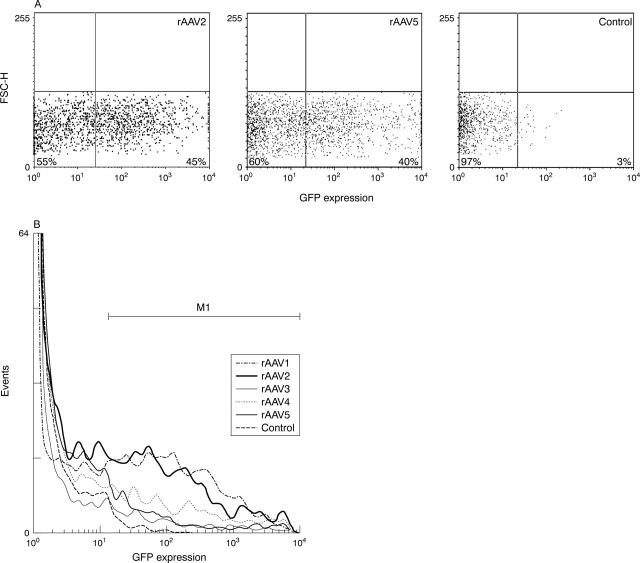
Figure 7.
Flow cytometric analysis of GFP expression in rAAV transduced FLS. Human FLS were incubated with rAAV2.GFP or rAAV5.GFP at a multiplicity of infection of 100. After 72 hours, the cells were washed and analysed for GFP expression by FACS. Flu-1 plotted against FSC-H showed 45% (left panel, rAAV2) and 40% (middle panel, rAAV5) GFP positive cells, compared with 3% in control cells (right panel), p<0.05 (A). Differences between rAAV2 and rAAV5 were not significantly different. In a histogram comparing GFP expression of control cells with all five rAAV serotypes, only differences between rAAV2 or rAAV5 and control or rAAV1, 3, or 4 proved significant using the Mann-Whitney U test (B) (p<0.05). Representative histogram of three independent experiments is shown.

