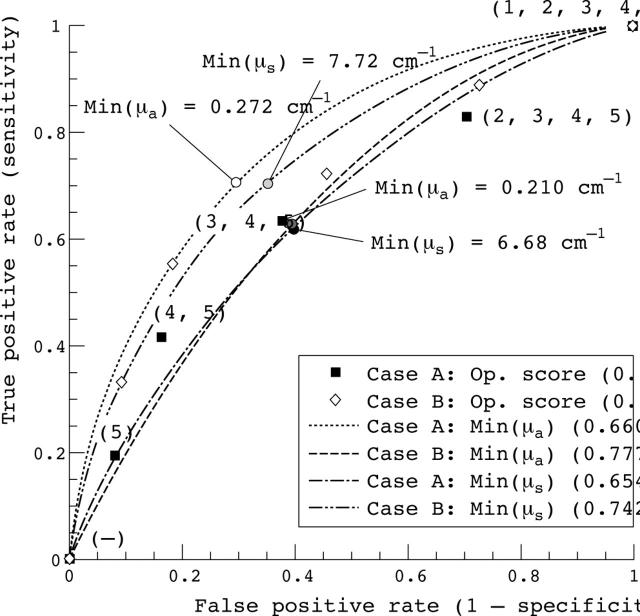
Figure 4.
ROC curves with ultrasound scores of 0—unaffected and 3—affected as diagnostic reference (case B) compared with ROC curves with ultrasound scores of (0, 1)—affected and (2,3)—unaffected as diagnostic reference (case A). The numbers in brackets are the area under the curve (AUC). Also given for each curve are the cut off values that result in the largest Youden index.

