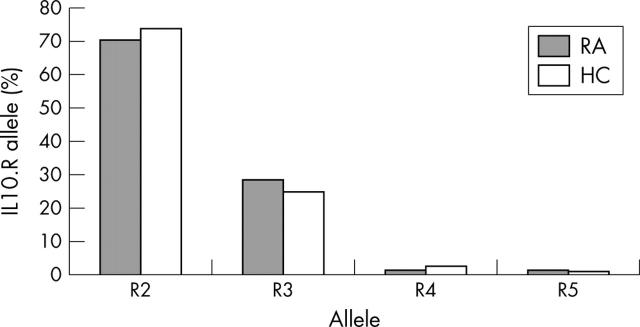
Figure 1.
IL10.R allele distribution in patients with RA and healthy controls (HC). Bars represent the allele frequencies in the respective population. Allele distribution was not significantly different between patients with RA (n = 100 alleles) and healthy controls (n = 378 alleles). χ2 (T4 statistics) = 0.62; p = 0.2232.

