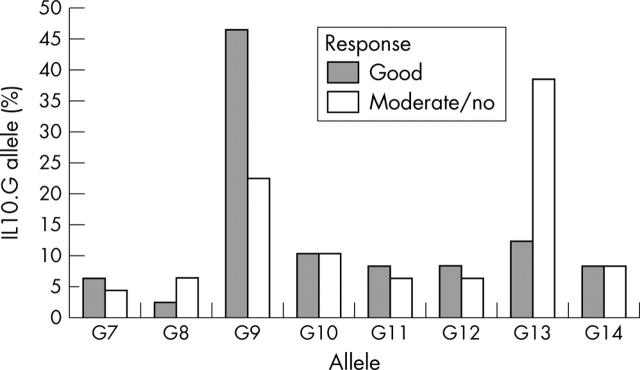
Figure 5.
IL10.G allele distribution in patients with RA as related to etanercept response. Bars represent the allele frequencies in the respective patient subgroup. Allele distribution was significantly different between patients responding well to etanercept treatment (n = 50 alleles) and patients responding moderately or not at all (n = 50 alleles). χ2 (T4 statistics) = 10.93; p = 0.0346.

