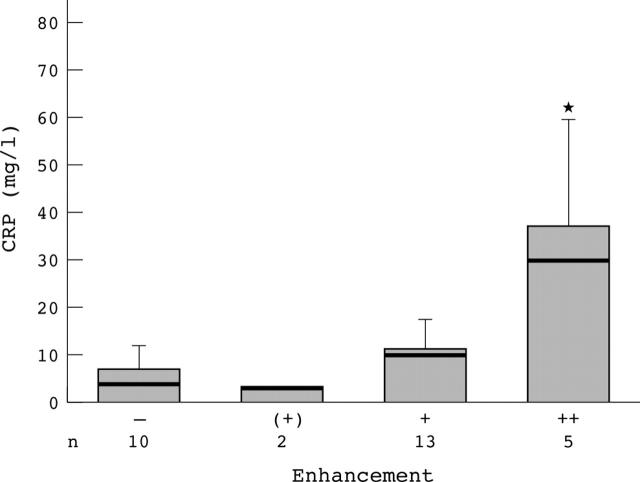
Figure 2.
Association of CRP values with the intensity of contrast enhancement. Significant increases (*p = 0.008) of CRP were detectable only with concomitant strong ("++") contrast enhancement. n = number of images. Bars represent means (SD). CRP medians are represented by the thick line within each bar.

