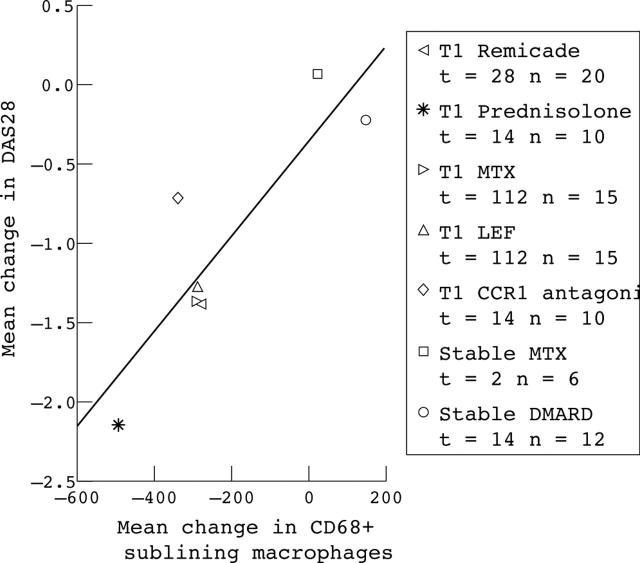
Figure 2.
Correlation between the mean change for each substudy in the number of CD68+ sublining macrophages and the mean change in DAS28 (p<0.01, Pearson correlation 0.874, weighted linear regression p<0.02, R2 = 0.755, 95% confidence interval (95% CI) 0.001 to 0.005). t, interval between the first and second measurement, n, number of patients; TI, treatment initiation.

