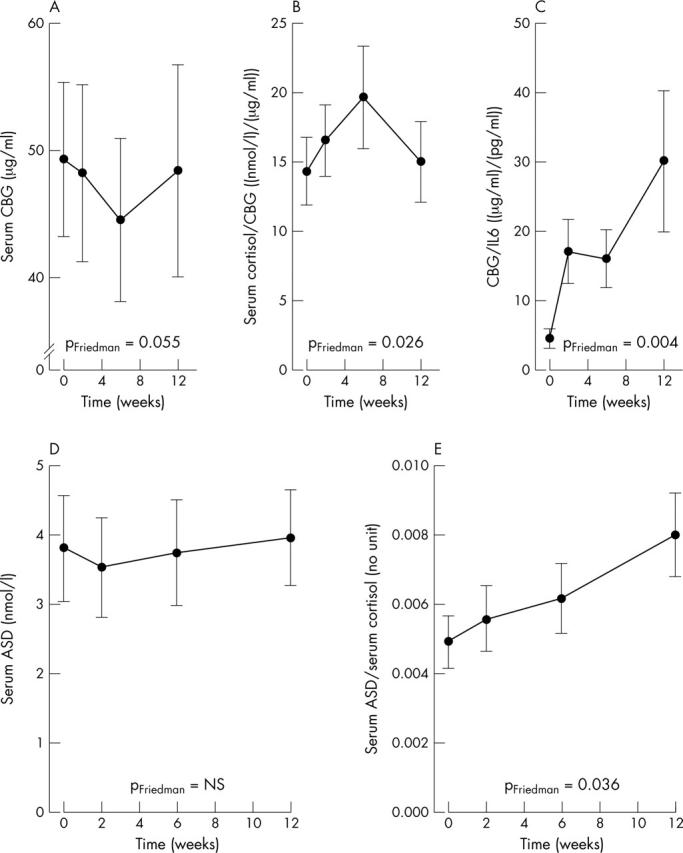
Figure 1.

Course of serum cortisol binding globulin (CBG) and androstenedione (ASD) in relation to cortisol during 12 weeks of anti-TNF antibody treatment in patients with RA. Baseline values are given as time point 0. The graph depicts serum CBG (A), the ratio serum cortisol/CBG (B), the ratio serum CBG/IL6 (C), serum ASD (D), and the ratio serum ASD/cortisol (E). The data are given as means (SEM). The p value according to Friedman's test is given.
