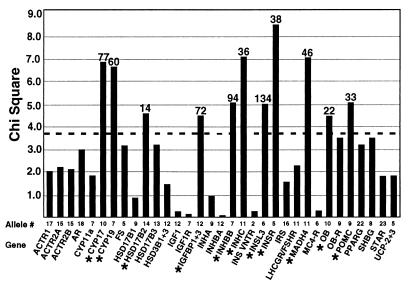
Figure 2.
Summary of TDT analysis. The dashed line indicates a χ2 value of 3.84 (P = 0.05). The candidate gene regions and the allele with the highest χ2 value for each region are listed on the x axis. Each allele with a nominally elevated χ2 (>3.84) is indicated with an asterisk, and the number of transmissions tested is shown above the bar. A total of 349 alleles at 45 loci were tested.

