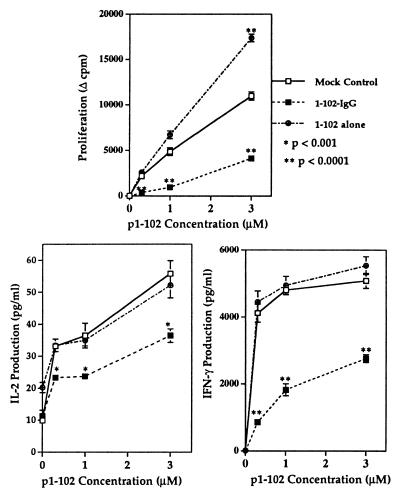
Figure 6.
Difference in memory T-cell responses between 1–102-IgG and 1–102 gene transfer. CB6 F1 mice were pretreated, immunized, and boosted as described in Fig. 4. T-cell proliferation and cytokine production of splenic T cells was measured 1.5 months after immunization. One set of representative experiments is shown, with five mice per group. Data are presented as mean ± SE.

