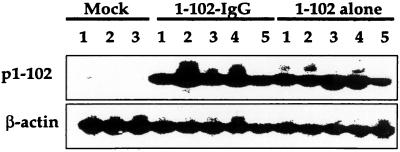
Figure 7.
Comparable levels of p1–102 mRNA expression between 1–102-IgG and 1–102. Spleen samples from the same recipients as in Fig. 6 were harvested (approximately 4 months after gene transfer), and the p1–102-specific mRNAs were measured by reverse transcription–PCR followed by Southern blotting using p1–102 as a probe.

