
Figure 1 .
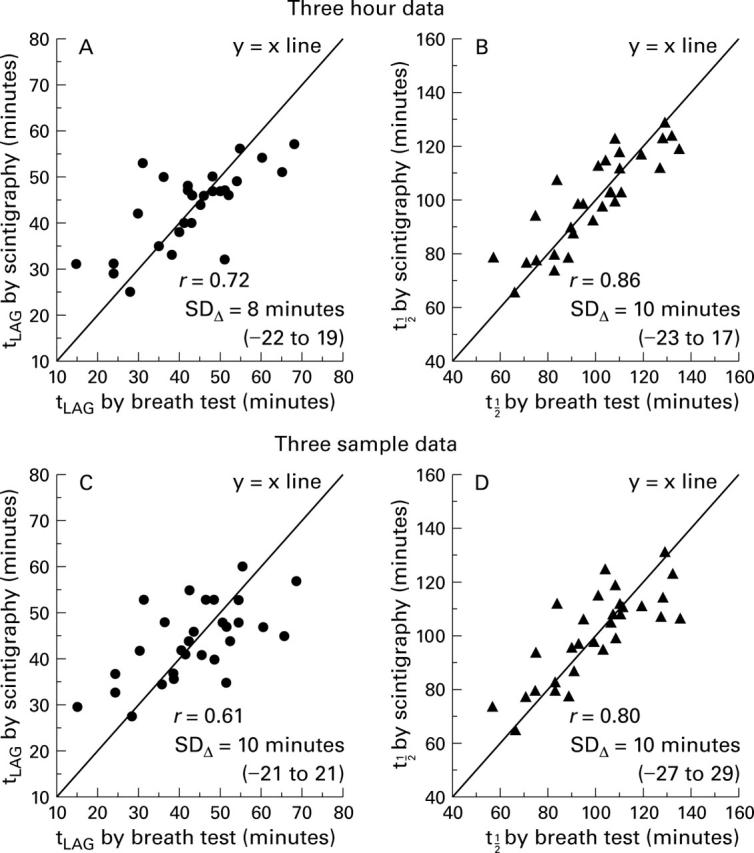
Association between lag phases (tLAG ) and half-emptying times (t1/2) for scintigraphy values compared with estimates from a generalised linear regression model based on breath test values from the first three hours of data (A, B) and for two time points from the first three hours of sampling (C, D; the y=x line is shown for comparison). Note the significant correlation between estimates. The variation in differences between estimates by the two methods is expressed as SDΔ and range.